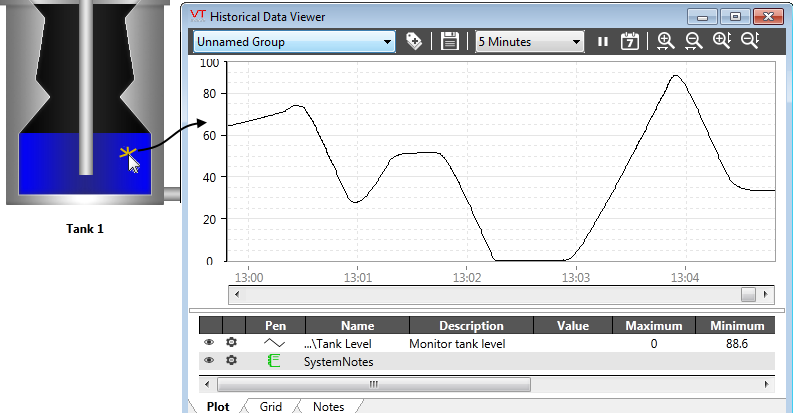
Open the HDV with a click on any tag:

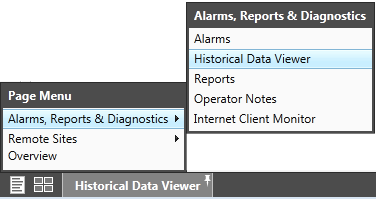
Open the HDV as a page:

If you right-click the menu entry, the page will open as a pop-up. Left-click for full screen.
The HDV will be the same, any way you choose to open it.
Selecting Tags to Plot
The HDV can show both analog and digital values (as separate plots).
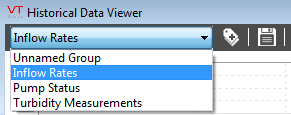
If named groups of pens have been saved for later use, select one from the drop-down menu.

If no groups have been created, you will have to use the tag selector. Refer to the online help for instructions, starting with the section, "Operate Your Application >> Plot Trends and Graphs".
Adjust the Appearance
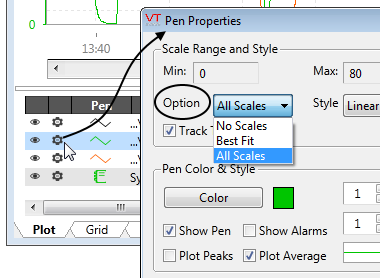
You have complete control over the pens used for each tag.
Make the lines thick or thin, dashed or solid, and any color at all.
Click the gear icon beside the pen name to open its properties dialog.

Add Notes to the Graph
If the pen legend includes one notebook, click the note icon, then click anywhere on the graph to associate the note with that moment in time. A marker line will be added on the time axis to let you know where (when) the note is.
........
If there are two notebooks in the legend, you will have to select which one to use.
Notes in the HDV are the same as Operator Notes. The initial dialog is small, but you can open the full Operator Notes page within the HDV.
Adjust the scale, separate the graphs, add or remove labels
The tools at the top of the HDV allow you to adjust either axis of the graph and add (or hide) extra information.
To use the magnifying glasses to zoom in or out, select one, then click on the graph. If no pens are selected in the legend, all will be affected. If one pen is selected, only that one will change scale.
Other tools found here allow you to change the time span, open a calendar, separate the graphs, reset the Y-axis and more.

Learn More
There are many, many tools in the HDV to help you extract information about processes in your application.
To learn more, open the online help and look for the chapter: Operate Your Application >> Plot Trends and Graphs.
