Summary (Live) Tab
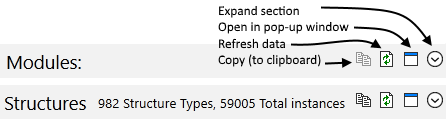
Contains extensive information about the current state of your VTScada installation and running applications. Details are grouped into bands that you can expand or close as needed. Several bands include a button to open the content as a pop-up window instead of expanding the band. Where appropriate, there may be a Refresh button that you can use to update the display.
This window also holds the Code Display and (when displayed) the Summary (Dump). Use tabs (located along the bottom of the window) to select which to display.
Information in this window includes:
Operating System
One line, not expanding. Windows version, 64 or 32 bit, # of cpu's.
VTScada Info
Expanding section showing version and license details.
Applications
Expanding section with two sub-sections, Running and Stopped. Click any running module to populate the Module Tree with that application's modules.
Child Bubbles
Expanding section that lists all child bubbles of the currently selected module.
Modules
Expanding section that lists all running modules from all applications including those for the VTScada system layer and the Source Debugger itself. Provides the number of instances currently running for each module.
Structures
A list of structures in the system and the count of each.
Threads
Expanding section that lists all running threads from all applications including those for the VTScada system layer and the Source Debugger itself. Provides the number of instances currently running for each module. Identifies the module and state that spawned the thread and whether the thread is active or inactive as of the last refresh.
Execution History
Expanding section that lists recently executed statements in order of execution. Details show the module, state and thread ID of each statement. You can filter the list by module or by thread.
See: Working with the Execution History
Profiler
Monitors all processes over several seconds, allowing you to create a detailed profile of exactly what is happening in your VTScada application. Use this to catch errors in your code such as statements that use excessive system resources.
See: Profiler
