Profiler
Prior to VTScada version 11.3.09, the Profiler was run as a utility application. It is now an integrated part of the Source Debugger. Customers who have upgraded their systems, installing a newer version of VTScada over an older one will still have the older Profiler application. If this describes your situation, you are urged to remove the older application from the VAM and use only the newer version within the Source Debugger.
Use the Profiler to discover statements that are placing an excessive load on system resources. If a particular statement runs for a large percentage of the data collection time, it may be due to an "If 1" (continuously executing) condition. A statement that is called an extremely large number of times may indicate an inefficient algorithm in your code. Statements of this nature can have a severe impact on the speed and performance of an application. The Profiler can help you recognize such statements and correct any problems.
The meaning of "high number" will vary depending on your application. It is helpful to run the profiler at different times and under different conditions to gain a sense of what is normal for any given application.
In addition to running the Profiler within the Source Debugger, you can open it within a pop-up window. This will create a separate instance that does not share statistics with the original. Closing the Source Debugger will also close the pop-up window. If you have unsaved data in a pop-up Profiler window, VTScada will prompt before closing, giving you the opportunity to save your data. You can also open multiple pop-up windows, which can be useful for comparing multiple profiles.
The Profiler analysis tool can be used in two ways: by collecting statistics about running statements during a defined collection period, or by taking an instant count of the number of statements of various priorities that are pending when the Stats button is clicked.
An example of the Profiler follows. Note the "Settings" button. This will open a configuration dialog that can adjust how the profiler works. The notes in the Profiler Settings topic contain important information for anyone who intends to save the data collected by the profiler.
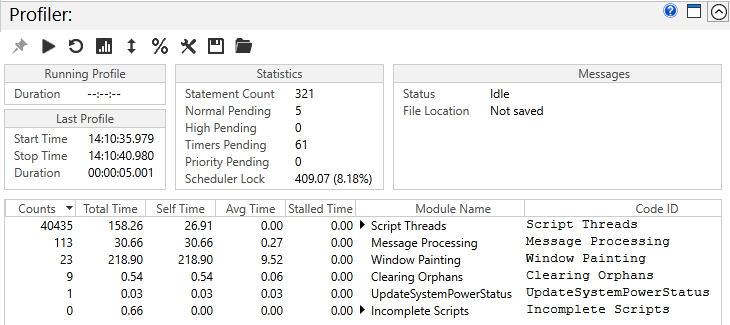
The Profiler includes the following elements:
Command Buttons
Pin
When selected, the Profiler will always be the top-most window. Enabled only when the Profiler has been opened as a pop-up window.
Start/Stop
Begins data collection. While the profile is running, the start button will become a Stop button.
Clear
Clears the history of the last profile collected. Does not apply to display of pending statements, collected by the Stats button.
Refresh Statistics
Click to collect information about the number of pending statements of various priorities. (These are described in the list of displayed information, later in these notes.)
Displayed Information
Running Profile
Displays an elapsed time count in seconds while a profile is being collected.
Last Profile
Shows the start time, end time and duration of the last data collection period.
Statistics
Updated at the end of each profile collection period or when the Refresh Statistics button is clicked. Includes the following information:
- Statement Count
Shows the number of statements that executed during the most recent profile. - Normal Pending
Shows the number of normal statements that were awaiting execution when the Stats button was clicked. For example, if a tag value changed just before you clicked the stats button, then there may be statements pending execution to react to that tag value change. If the Normal Pending value is very high, it may indicate that the script-execution engine is heavily loaded. This value cannot be taken by itself to indicate system loading since an IF-1 condition may create a large load while only adding 1 statement to the list of those pending. - High Pending
Similar to Normal Pending but shows the number of high priority statements that were awaiting execution. - Timers Pending - Shows the number of time-related functions that were pending. A large number of these may indicate poor design.
- Priority Pending - Shows the number of priority statements that were awaiting execution. Steady-state priority functions generally place a heavy load on system resources.
Grid Display Items
All measured times in the source debugger, apart from Stall times, represent time spent within the scheduler lock, which is the exclusive lock that the vast majority of script execution happens within. This exclusive lock is the primary resource that the profiler is profiling.
Counts
The number of times each statement executed during the most recent profile.
Total Time
When the Profiler is in the normal (non-Flip Tree) view, the total time is the scheduler lock time taken by that statement and all statements under it in the tree.
In the Flip Tree view, total time is not meaningful.
Self Time
The time spent by that statement, not including all of the other profiler nodes underneath it in the tree.
Avg Time
Total time divided by Counts.
Stalled Time
The amount of time that a particular statement spent outside of the scheduler lock. For example, the ODBC() function stalls while the ODBC command executes. Statements on other threads can execute while a statement is stalled, but statements on the same thread as the stalling thread are held-up by the stall. A long stall on a GUI thread (eg Display Manager or VIC thread) leads to an unresponsive GUI. A long stall on the application thread leads to problems such as data not updating.
Module Name
The name of the module (within the identified source file) that contains each statement.
Code ID
For each statement, identifies the folder where the module file can be found, the module name, the running state within the module and the numerical index of the statement within that state. If you have access to the .SRC file of the module, you may click this item to open the file. Note that if you are using the pop-up profiler window, the file may open in the background.
