Steps to Create a Report
The report page is organized into numbered sections, indicating the steps required to configure and run a report. For each step, there are several decisions to make.
If the output uses a Microsoft Excel™ file, and you have an older version of that program using the XLS file format, you may be limited to 255 columns (tags) in your report. Modern versions of Excel, using the XLSX format will support up to 16383 columns.
VTScada will automatically detect the installed version and produce an output file using the format it supports, XLS or XLSX
The generalized steps are as follows:
Analytics, analysis, analyze
1. Select the type of report to create.
For the list of options, see: Report Types Described
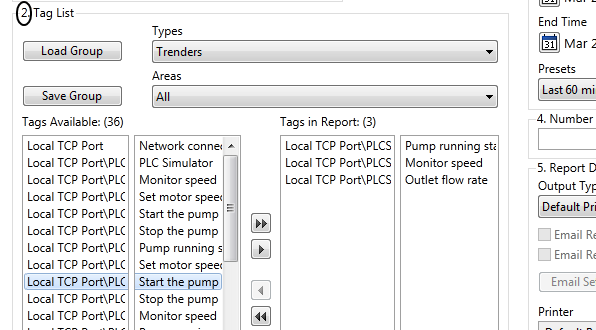
2. Select the tags to include.
The types of tag available for selection will be limited by your choice of report type. You can use the Areas selector to further filter the list.
Use the arrow buttons to move tags from the list of those available to the list of those selected.
This task is much easier if the tag selection is saved, to be loaded the next time the report is run.
After selecting tags, you should save the set as a named group, to avoid repeating work the next time that you run the report. Saved groups are required when creating Report Tags.
- Select the tags to be included by moving them from the Tags Available list to the Tags In Report list.
- Click the Save Group button.
The Select Group Name dialog opens.- Either type a descriptive name for the tag group in the Group name field, or select an existing group name to update with the new tag selection.
- Press tab or click out of the field to enable OK. Click OK.
Groups are saved to *.GRP files in your application's ReportGroups folder. They will be included in ChangeSets.
Load a Tag Group:
- Click the Load Group button on the Reports page.
The Select Group Name dialog opens.- Select the tag group you wish to load.
- Click on the down arrow in the Group Name area, or start typing the name of the group you want.
- Press tab or click out of the field to enable OK. Click OK.
The tags belonging to the tag group are placed in the Tags In Report list.
When you load a tag group, those tags replace any that were already in the "Tags In Report" list.
Tip: VTScada requires you to navigate the focus outside of a field before it will register the contents of the field. You can do this by hitting tab or clicking out of the field. This is a feature that enables you to input information with purpose and deliberation. One more opportunity to quality check your work and avoid troubleshooting later.
Sorting
Tags are sorted in alphabetic order, but you have the option to change the order as desired by deselecting the Sort Alphabetically option, then using the arrows to move selected tags up or down in the list.
3. Select the report's time span.
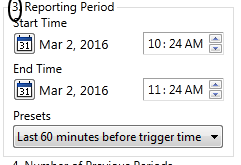
An extensive list of preset time-periods is available. In almost all cases, you will be able to find one that matches what is required for the report.
Presets set the start and end time, relative to when you change the choice of preset. If you run a report for the "Last 4 hours before trigger time", then wait an hour and run the report again, the start and end times will not change.
In the case that there isn't a preset for the time span required, you can generate your own using the Start Time and End Time controls provided.
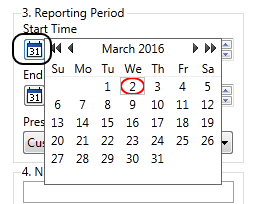
a) Click the calendar button to open a date-selection calendar. (If you wish to report on a time span prior to today.)
b) Use the up-down arrows in the time fields to set the hour and minutes, or type directly in the time fields.
Note that you cannot set an end prior to the start.
4. Choose whether to repeat the report for multiple iterations of that time span.
Leaving this field blank is the same as specifying "1 time period". Any larger value will cause the report to repeat for consecutive time periods of the same length set in step 3, where each iteration is for an earlier (previous) span of time.
Options in step 6 allow you to control how these iterations are included in the report output.
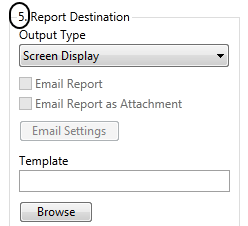
5. Select the output format and destination.
The drop-down list provides the main list of Report Formats and DestinationsReport Formats and Destinations. Both format and destination are controlled here, where the list includes combinations of each.
Formats include text file, Excel-compatible spreadsheet, Access database file, or other ODBC database. Destinations include screen, printer, email and file on disk.
The choice of destination affects the choice of format and vice-versa.
If an email server has been defined, you can choose to send most formats by email. The settings dialog will prompt for a From address, a Subject and a To address. Email addresses may be in the basic form, Name@Company.Com" or you may use either of the following longer forms. Multiple addresses may be entered, separated by semi-colons or commas. Do not add spaces within the angle brackets.
"Full Name" <Name@company.com>
-or-
Full Name <Name@company.com>
When running VTScada as a Windows service, DO NOT select Excel as an output destination or option from a Report Tag. As noted in the MSDN forums, office applications assume they are being run under an interactive desktop. If Excel attempts to open a modal![]() A modal dialog is always displayed on top of the calling window and prevents further interaction with that window. dialog from a non-interactive service, the result is an invisible dialog that cannot be dismissed, stopping the thread.
A modal dialog is always displayed on top of the calling window and prevents further interaction with that window. dialog from a non-interactive service, the result is an invisible dialog that cannot be dismissed, stopping the thread.
Besides the technical problems, you must also consider licensing issues. Microsoft's licensing guidelines prevent Office applications from being used on a server to service client requests, unless those clients themselves have licensed copies of Office. Using server-side Automation to provide Office functionality to unlicensed workstations is not covered by Microsoft's End User License Agreement (EULA).
6. Optionally, fine-tune the output format.
The first option applies if you have chosen to output the report to the screen. If not selected, a plain text file format is used.
The second and third options apply if previous periods are being generated (step 4) and the output is going to either Excel or Access format. Using separate sheets or tables for each iteration keeps the consecutive periods independent. If the Rename option is selected, you will be prompted for names when the report runs.
7. Click the Run button to generate the report.

A progress dialog will be shown while the report is being generated. In most cases, you will likely want to select the option, "Close this dialog when the report is complete" so that you do not need to close it after every report runs.


