Adjust the Plot
There are several ways that you can adjust scale and placement of pens in the HDV graph.
(Does not apply to digital tags.)
You can control the default scale range for analog pens. The scale can be set in the tag configuration, within the pen properties, or allowed to float, automatically adjusting to the currently displayed values. See: Analog Pen Property Reference
For a given time span, an analog tag's value may not change significantly compared to the full scale range. By changing the displayed scale ("zoom-in" or "zoom-out"), you can increase the amount of information available.
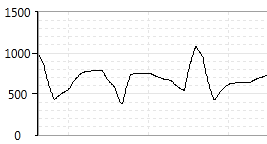
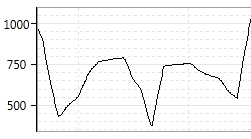
For example, the following two images show the same information, but in the second, the displayed vertical scale has been adjusted to show values from 500 to 1000 instead of 0 to 1500.
For the following instructions, if a tag is selected in the legend, the action will apply only to its pen![]() Any data source displayed on the graph. This includes notebooks as well as analog and digital tags.. Otherwise, the action will apply to all the pens.
Any data source displayed on the graph. This includes notebooks as well as analog and digital tags.. Otherwise, the action will apply to all the pens.
To change the vertical scale:

- Decide whether to scale one pen or all pens
- If one pen, select that pen in the legend.
- If all pens, select no pens in the legend. Click on any that are selected, to deselect them.
- Decide whether you want to view a smaller scale range (zoom in) or a greater scale range (zoom out).
- If a smaller scale range, click the Zoom In Y-Axis button.
- If a larger scale range, click the Zoom Out Y-Axis button.
- Click on the analog graph.
- Each click on the graph while the Zoom In or Zoom Out button is selected will take you one step further in or out.
Troubleshooting:
- You have zoomed too far and lost the pen.
Click the Reset Y button.
Shift a pen up or down
(Does not apply to digital tags.)
When plotting several tags, you may want to shift the position of one or more of the pens to either separate the graphs for clarity, or to superimpose them for comparison.
To shift a pen position:
- Decide whether to shift one pen or all pens.
- If one pen, select that pen in the legend.
- If all pens, select no pens in the legend. Click on a selected pen to deselect it.
- Click on the Shift Y-Axis button.

- Click on the graph and, while holding the left mouse button down, drag the pen display up or down.
Remove or hide pens in the HDV
When several pens are plotted on the same graph, you may want to hide one or more temporarily so that you can better view the remaining pens. Alternatively, you may want to remove the pen altogether.
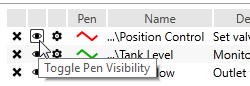
To hide a pen:
- Click the eye icon beside that pen's entry in the legend.
The pen will be removed from the graph and the legend entry will turn gray to indicate that the pen is hidden.
To reveal a hidden pen:
- Click the eye icon a second time.
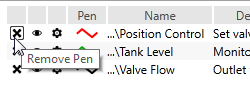
To remove a pen:
- Click the X icon beside that pen's entry in the legend.
The pen will be removed from the graph and from the legend. If you were viewing a named group of pens, then you are now viewing an unnamed group.
To return the pen to the plot, either select it again, or change the group list to re-select the named group you were previously viewing.
Separate the graphs
When more than one pen is being plotted, the overlapping lines may be difficult to see. Rather than shift a pen up or down, you can also separate the pens into their own graphs at the click of a button. Note that this applies to only analog plots.
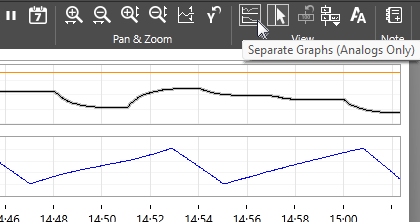
To separate analog graphs:
- Click the Separate Graphs button.

- Click again to merge the pens into a single graph.
Note that separating a large number of graphs may result in a very small display area for each.
Reset the scale and position
(Does not apply to digital tags.)
If you have adjusted the graph's scale or vertical position, you may decide that you want to return to the default display. This can be done for either a single pen, or for all pens using the Reset Button.
This operation applies only to vertical adjustments. There is no default for the horizontal scale (displayed time span) of the graph. Also, changes that you have made to color, line style and other properties are not affected.
To reset the scale range:
- Decide whether to reset one pen or all pens
- If one pen, select that pen in the legend.
- If all pens, select no pens in the legend.
- Click on the Reset button.
