Analog Pen Property Reference
The appearance of the pens that are used to display analog plots can be adjusted as follows:
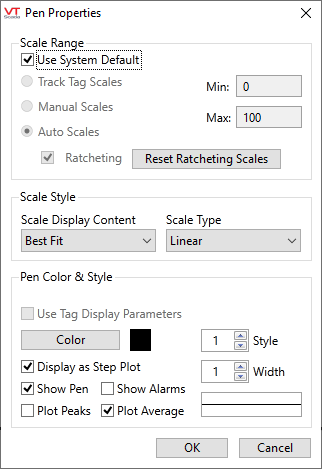
- Double-click the pen in the legend, or click the gear icon to open the properties dialog.
| Analog Pen Properties Element | Description |
|---|---|
| Scale Range | |
| Use System Default |
Selected by default. Applies the value stored in application property, HDVAnalogPenAutoScaling. The default of HDVAnalogPenAutoScaling will vary depending on whether this is a new application or a legacy application created before the release of VTScada version 11.2.22. In legacy applications, auto-scales were not available therefore the default behavior is that they are not used. In new applications, auto-scaling is the default. This option must be deselected to use any of the following: |
| Track Tag Scales | Select this option to have the graph display the scale range defined in the tag. |
| Manual Scales | Select this option to set the scale range within this dialog using the Min and Max boxes. |
| Min & Max | The range of the displayed scale. If the Manual Scales option is selected, then you can use these fields to provide your own scale range for the tag. Otherwise, these fields are display-only, showing the scale range currently in effect. |
| Auto Scales | Causes the scale to change according to the displayed values of the tag. See also, Ratcheting. |
| Ratcheting |
An option used in combination with Auto Scales. If selected, the maximum scale value will increase as required to display the maximum value of the tag, and will not decrease. The minimum scale value will decrease as required to display the minimum value of the tag and will not increase. See also, Reset Ratcheting Scales button. If this option not selected, both values will increase or decrease periodically according to the minimum and maximum tag values within the displayed time on the graph. |
| Reset Ratcheting Scales Button | Available only when Auto Scales is selected and ratcheting enabled. Causes the scales to be recalculated for the current display on the graph. |
| Scale Style | |
| Scale Display | Choose whether to display a full scale (all scales), a best fit scale or no scale. |
| Scaling Type | Select one of the three possible graph types: Linear, Logarithmic, Square Root. |
| Pen Color & Style | |
| Use Tag Display Parameters | For analog I/O and Calculation tags. Enabled only when selected, color and style parameters are configured in the tag. Deselect to override the tag's configuration with values set here. |
| Color | Opens the Select Color palette, which you can use to select a new color for the pen. |
| Pen Style | A spin-box that you can use to change the line style (solid, dashed, etc.). Affects the choice of width, in that you cannot select a wide line for any style other than solid. |
| Display as a step plot | Intended for I/O and Calculation tags configured in the Discrete data type. Steps from one value to another will be vertical (or as close as possible) rather than include interpolated values. |
| Width | A spin-box that you can use to set the width of the pen. Affects the choice of style, in that choosing a wider line forces the line style to be solid. |
| Show Pen | Hides this tag's pen when not checked. |
| Show Alarms | Add horizontal lines to the graph that show the current value of alarm set-points associated with this tag. |
| Plot Peaks | When each pixel represents several logged values, the graph is normally an average of the values represented by each pixel. If Plot Peaks is selected, then two lines will be drawn - one for the maximum of those values covered by a pixel and one for the minimum. See also, Plot Average |
| Plot Average | The normal graph through for a pen - each pixel shows the average of the logged values represented by a pixel since there are usually more logged values than displayed pixels over a time span. See also, Plot Peaks. |
