Custom Meters
If your site uses meters that do not look like any that are included with VTScada, you can build your own using the components provided in the Tools >> Meter parts folder of the Widgets palette.
A custom meter is a Tag Widget, typically including several parameters for configuration. The
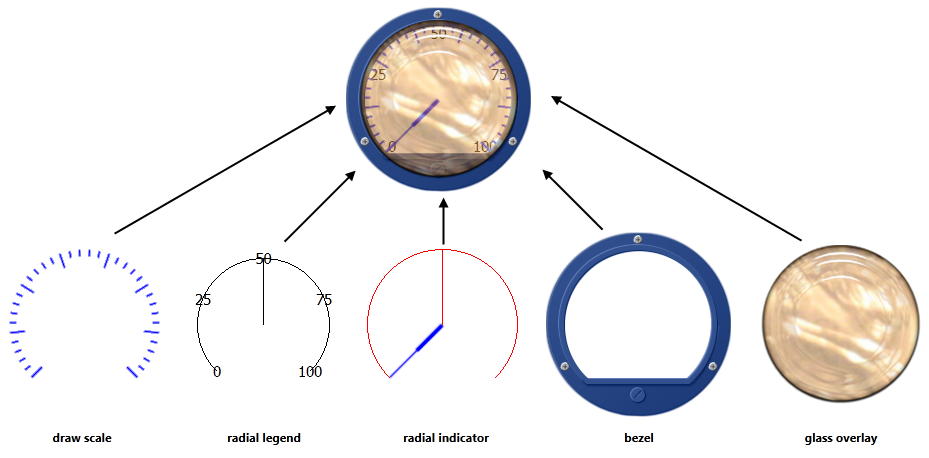
Note that the bezel and the glass overlay are images, found in the Meter Parts folder of the Images palette.
Example:
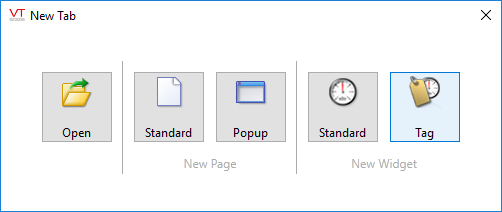
- Working in the Idea Studio, create a new, empty tag widget.
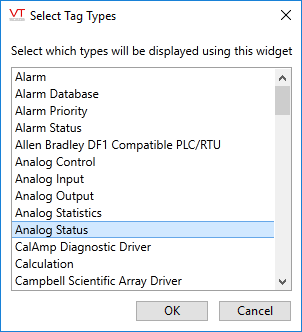
- When prompted for tag types, select Analog Status tags (assuming that these are what you use most often). You will probably want to also be able to use the meter with other tags that have analog data such as Analog Input and Calculation, but this can be left until later.
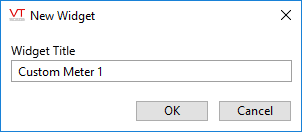
- You will be prompted for a title. In this example the widget will be named Custom Meter 1.
- A nearly-blank screen will open, containing only the Tag Icon Marker. Ignore the marker for now.
- In the Widgets palette, navigate to the Tools >> Meter Parts folder.
- Start by dragging a scale to the screen. For this example, a Radial Scale was used.
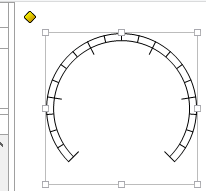
- Open this object's properties dialog and adjust the appearance as you wish.
- Make a note of any properties that you want to be adjustable in the finished widget. For each, you must create a parameter in your widget. For the scale in this example, only the number of major divisions will be made available to users of our custom widget.
- Close the properties dialog then open the Widget Properties ribbon.
- Open the Manage Parameters tool and click Add.
- The example parameter was named pMajorDivisions (where "p" stands for "parameter"). The type is Short because there should never be more than a few divisions in the meter.
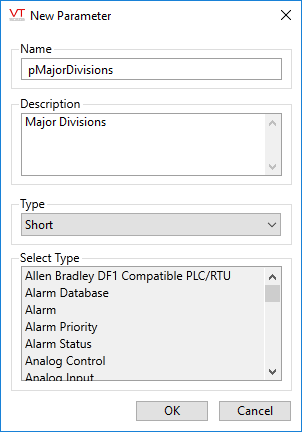
- After adding the parameter, click OK to close the Manage Parameters dialog.
- Click the Values tool in the Widget Properties toolbar to open the Edit Parameters dialog. Setting values here does not assign defaults. It simply gives the parameter a value to show while working in the Idea Studio.
- In this example the value for pMajorDivisions is set to 6.
- Re-open the properties dialog for the legend. Set the data source for Major Divisions to Parameters, then select pMajorDivisions.

It is unlikely that you will want to make every parameter of every component of your meter available to users to customize. For those parameters that you do want to want to expose, you must repeat the same sequence of steps that you have just completed.
- The next step in this example is to add a radial legend. Drag one to the screen, placing it above the scale.
- Re-size the legend so that the text fits within the circle of the scale, then align midpoints.
- The number of labels must match the number of major division marks, which is one greater than the number of divisions. You can use the pMajorDivisions parameter as part of an expression.
- Change the data source for the number of labels to use Expression.
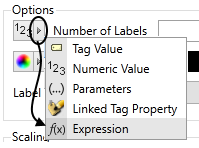
- In the expression field, type pMajorDivisions + 1

- Leave the properties dialog open after completing this step. If you would rather have whole numbers in the legend, change the value of the pMajorDivisions parameter to be an odd number.
The numbers in the legend should reflect the scaling of the linked tag. Several steps will be required to achieve this.
- Expand the data source for the Tag parameter of the legend and choose Linked Tag Property.
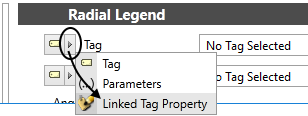
- In the drop down list, select Linked Tag (Analog Status).

- In the Scaling section of the properties, select the option, Use Tag Scaling, then click OK to close the properties dialog.

The next component to add will be the indicator. A radial Indicator was used for this example.
- Place the indicator so that it is aligned with the other components, scaling if desired. If you would like to change the color of the indicator, note that the starting color is blue rather than the standard gray. This means that you must open the advanced options for the indicator and adjust the hue and saturation sliders rather than simply applying a color. Refer to the notes for the Radial Indicator for more information.
- The data source must be the Linked Tag (Analog Status), as for the legend. Ensure that the Use Tag Scaling option is selected.
- To add a finish to the meter, add images for the bezel and glass overlay. A selection can be found in the Images palette under Widget Parts >> Meter Parts.
- Select all components and align midpoints.
- Move the entire selection so that your meter just touches the top and left edge of the Idea Studio window. This corner is the standard reference location for all widgets.
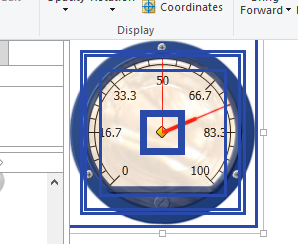
- If you use the meter with tags other than Analog Status, return to the Widget Properties ribbon and use the Tag Types tool to associate other tags. Analog Input and Calculation are suggested.
To find and use your new meter, you will need to add it to a palette.
- In the Widgets palette, open the Gauges folder.
- Right-click anywhere within this palette and select New from the menu that opens.
- In the New Item dialog, select Advanced.
- In the New Menu Item Properties dialog, select Widget.
- Find and select Custom Meter 1.
- When you return to the New Menu Item Properties dialog, click the Set Parameters button. You may choose to assign a default value here for the number of major divisions. Click OK when finished.
- Open a page in the Idea Studio (not a widget) and drag your new meter to that page. Link it to a tag. You may open the properties dialog to adjust the parameter, Number of Major Divisions.
Sample Widget - For advanced developers. Source code of the Antique Bolted meter.
