
Not counted towards your tag license limit.
Rate of Change tags are used to display how quickly another tag’s value is changing. They can be used to watch for system problems such as leaks and blockages.
The Rate of Change tag calculates the first derivative of another tag’s value. In general terms, this is defined as the change in value divided by the change in time. (For example, speed rather than position. This tag tells you how fast something is changing, not where it is. But, if the tag you monitor is the speed (or perhaps a rate of flow), and that speed or rate of flow remains constant, then even though the car is moving or the fluid is flowing, the rate of change of what you are monitoring is zero.)
The source tag's value must be logged in order for the Rate of Change tag to work properly.
The rate of change will be positive if the source is increasing in value, and negative if the source is decreasing. The tag can be configured to report the absolute rate instead, thus showing a positive number for any rate of change.
Note that in multi-server applications, the Rate of Change tag information is distributed from the server to workstations on a regular interval (default: 60 seconds) or when the value changes by a given percentage (default: 5%). These values are controlled by variables in your configuration file.
See variables: RateOfChangeTagRPCThreshold , and RateOfChangeTagRPCInterval
The ID tab of every tag includes the same common elements: Name, Area, Description, and Help ID.
Name:
Uniquely identifies each tag in the application. If the tag is a child of another, the parent names will be displayed in a separate area before the name field.
You may right-click on the tag's name to add or remove a conditional start expression.
Area
The area field is used to group similar tags together. By defining an area, you make it possible to:
- Filter for particular tag groups when searching in the tag browser
- Link dial-out alarm rosters to Alarm tags having a particular area
- Limit the number of tags loaded upon startup.
- Filter the alarm display to show only certain areas.
- Filter tag selection by area when building reports
When working with Parent-Child tag structures, the area property of all child tags will automatically match the configured area of a parent. Naturally, you can change any tag's area as required. In the case of a child tag, the field background will turn yellow to indicate that you have applied an override. (Orange in the case of user-defined types. Refer to Configuration Field Colors)
To use the area field effectively, you might consider setting the same Area for each I/O driver and its related I/O tags to group all the tags representing the equipment processes installed at each I/O device. You might also consider naming the Area property for the physical location of the tag (i.e. a station or name of a landmark near the location of the I/O device). For serial port or Roster tags, you might configure the Area property according to the purpose of each tag, such as System or Communications.
You may define as many areas as you wish and you may leave the area blank for some tags (note that for Modem tags that are to be used with the Alarm Notification System, it is actually required that the area field be left blank).
To define a new area, type the name in the field. It will immediately be added. To use an existing area, use the drop-down list feature. Re-typing an existing area name is not recommended since a typo or misspelling will result in a second area being created.
There is no tool to remove an area name from VTScada since such a tool is unnecessary. An area definition will exist as long as any tag uses it and will stop existing when no tag uses it (following the next re-start).
Description
Tag names tend to be brief. The description field provides a way to give each tag a human-friendly note describing its purpose. While not mandatory, the description is highly recommended.
Tag descriptions are displayed in the tag browser, in the list of tags to be selected for a report and also on-screen when the operator holds the pointer over the tag’s widget. For installations that use the Alarm Notification System, the description will be spoken when identifying the tag that caused the alarm.
The description field will store up to 65,500 characters, but this will exceed the practical limits of what can be displayed on-screen.
This note is relevant only to those with a multilingual user interface:
When editing any textual parameter (description, area, engineering units...) always work in the phrase editor. Any changes made directly to the textual parameter will result in a new phrase being created rather than the existing phrase being changed.
In a unilingual application this makes no difference, but in a multilingual application it is regarded as poor practice.
Help Search Key
Used only by those who have created their own CHM-format context sensitive help files to accompany their application.
The Settings tab is used to select which tag is to be watched and how often it is to be checked. Examples are provided at the end of this section.

Source
Use this option to select the tag to be monitored for changes in value.
If you would like to monitor the rate of change of some combination of tags or a calculated value, you should create a Calculation tag with the expression you need and use it as the source.
Source Time Scale
Sets the measurement rate for the change. Available options include: per Second, per Minute and per Hour. Use when your tag is measuring a rate so that this matches the configuration of the flow meter (gallons per minute or liters per second).
If you are monitoring a level rather than a rate, with readings taken from the tag on change, then set this to "per Second" and do all your calculations in units / second.
Positive Rate
When selected, the absolute value of the rate of change will be shown. Otherwise, a decreasing value in the source tag will be displayed as a negative rate of change.
Refresh Interval and Period
- The Refresh Interval sets how often the rate of change is calculated. This value is always measured in seconds.
- The Period defines the length of time over which the change is to be measured. It is also measured in seconds.
The rate of change is roughly defined as the amount by which the value has changed during a given period, divided by the length of time in the period. To state it more accurately, the rate of change is the calculated derivative (dy/dx) of the plotted value.

The rate of change calculation is affected by data noise and transient spikes. The period should always be set to a value larger than the frequency of data noise. To avoid alarms due to transient noise, set a delay on the alarm. (see: Rate of Change properties Alarms tab.)
Examples
Adjust the settings according to the whether you are interested in the instantaneous rate or the rate over a longer time period. If the instantaneous rate of change is important then decrease the Period and the Refresh Interval: (at the extreme: "per Second", 1, and 1)
Example 1) You want to check every 10 minutes that over the last 6 hours the rate of change (ROC) has not dropped below -0.5ft/6hrs, (which is approximately -0.0833ft/hr or a very small -0.0000231/sec)
- Set Source Time Scale to "per Hour" because you want to compare ROC to -0.0833ft/hr.
- Set the Refresh Interval to 600 because you want to calculate the ROC every 10 minutes.
- Set the Low Alarm Setpoint to -0.0833ft because this is minimum rate you want.
Example 2) You want to check every 10 minutes that over the last 1 hour the ROC has not dropped below 0.0833ft/hr (The same as the above example, but watching a smaller time span of one hour rather than six.)
- Set Source Time Scale to per Hour because you want to compare ROC to -0.0833ft/hr.
- Set the Period to 3600 because you want to check whether rate of change over a 1 hour period or 3600 seconds is -0.0833 or less.
- Set the Refresh Interval to 600 because you want to calculate the ROC every 10 minutes.
- The Low Alarm Setpoint will again be -0.0833
The second case gives more cautious results because if the ROC calculated in the last hour continues at -0.0833ft/hr, it will definitely cause the level to drop by at least 0.5 feet within the next 5 hrs.
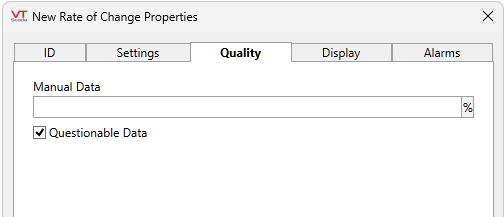
The Quality tab is used during the Quality portion of commissioning or testing changes to a system.
Questionable Data
Use this field to flag the tag’s data in the event that you suspect the values it is reporting might not be correct, or when this tag has initially been created and you wish to ensure that its data is marked for extra monitoring.
Manual Data
Sets a constant value that will be used instead of live data. Use when testing a new tag if you need to check behavior when a value is outside the normal operating range. Tags that have manual data are marked by a flashing exclamation mark within any linked widgets. Logged values are marked with an exclamation. Always reset this to blank after testing.
The controls in the display tab are used only in connection with the Historical Data Viewer (HDV). The Displayed Value Minimum and Maximum set the initial limits of the y-axis for this tag when it is viewed in the HDV.
These fields do not scale the data.
Engineering Units
Used by various widgets. Set this field to display the units of the rate of change.

You can set alarms to notify operators when the rate of change is either too slow or too fast.
High alarms are triggered when the rate matches or exceeds a set point. Depending on whether the Positive Rate option is selected on the Settings tab, the Low Alarm can be used either to warn on large negative changes, or to warn when the rate of change falls below a desired minimum.

Low and High Alarm Priority
The Low and High Alarm Priority drop-down lists are used to select the priority of the alarms that will be triggered for this tag. The default priority is None, indicating that neither alarm has been configured. The available priorities are:
- None
- 0 - Event
- 1 - Critical Alarm
- 2 - High Alarm
- 3 - Warning Alarm
- 4 - Notice Alarm
If you have defined your own Alarm Priority tags, those will also be available for selection.
Low and High Alarm Setpoints
Use the Low Alarm Setpoint field to enter the lowest value that this rate of change value will be permitted to attain, after which a low alarm will be triggered. Correspondingly, the High Alarm Setpoint is used to set a value at which the high alarm should be triggered.
If the Positive Rate option is selected on the Settings tab, all rates of change will be positive. In this situation, the high alarm is used to warn of excessively high rates of change (whether the changing value is rising or falling). The low alarm could be used to warn of change rates that are too slow.
If the Positive Rate option is not selected, the high alarm will warn only of excessive change rates for values that are rising. The low alarm set point should be set to a negative value to warn of excessive change rates for values that are falling.
The source for these fields may be either a constant, the result of an expression, or the value of a tag. Please see the topic: Constant, Expression or Tag for more information on selecting between these three choices.
Low and High Alarm Deadbands
If noise in the system causes a value to fluctuate above and below the set point, the alarm will repeatedly switch between active and inactive status. By using the deadband, you can dampen out these fluctuations by setting an amount by which the tag’s value must retreat back past the set point before the alarm state is considered to no longer be active.
For the low alarm, this means that the value must rise <deadband> units above the set point. For the high alarm, the value must fall by <deadband> units below the set point.
The deadband is used only for changing a current alarm’s active status. It does not affect the set point.
Low and High Alarm Delays
Noise in the value being monitored may cause transient spikes or drops in the reported rate of change. To avoid having alarms triggered by system noise, you can set a delay in seconds. The value must meet or exceed the alarm set point for the length of the delay time before an alarm will be activated.
Disable Low or High Alarm
The Disable … Alarm field is used to specify whether either the low alarm or high alarm for this tag is enabled. Disabling of alarms is typically used in situations where you wish to avoid false alarms. For example, in the event that routine maintenance is being performed on the equipment represented by this tag, the alarm can be disabled until the maintenance is complete and communications are re-established.
The value can be provided via any of a constant, an expression, or a tag, where 0 means "not disabled" and 1 means "disabled.
Please see the topic: Constant, Expression or Tag for help selecting which to use.
Low Alarm Pop-up Enable & High Alarm Pop-up Enable
If the configuration variable AlarmPopupsEnable is set to 1, then setting either the Low Alarm Pop-up Enable or the High Alarm Pop-up Enable, will result in a pop-up dialog being displayed whenever the respective alarm is triggered. It is strongly suggested that this feature be used sparingly.
Sound
The Sound fields can be used to set the sound that will be played when either the low alarm or the high alarm is triggered. These fields can be set to blank, 0, 1, or to the name of a .WAV sound file to be played.
If a Sound field is set to 0, no sound will be played when this alarm is triggered.
If a Sound field is set to blank or 1, an alarm sound whose properties are configured on the associated Alarm Priority tag will be played.
If a Sound field contains the name of a .WAV sound file, it will override any alarm sound configured for the associated Alarm Priority tag. When specifying a sound file, you must enter its name and extension (e.g. MySound.wav). The specified sound file must be a .WAV file, and must be stored in the application directory. If the specified sound file is not found, the alarm will revert to using tones as specified in the associated Alarm Priority tag.
The period must be set to a value that is larger than the refresh interval for the Rate of Change tag to work properly. Attempting to set either value such that this is no longer the case will result in the following error dialog:

Acknowledge the dialog by clicking on the Close button, then adjust the complementary value (either a larger period or a smaller refresh interval) before continuing to set the value you were first attempting to set.
The following widgets are available to display information about your application’s Rate of Change tags:
