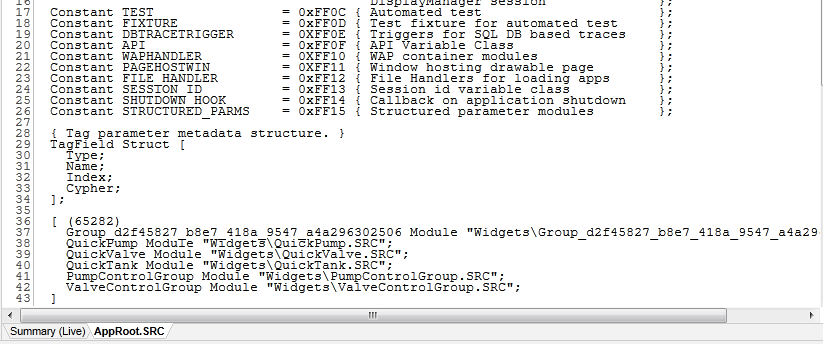
Code Display Window
The code display window occupies the center of the Source Debugger. This window also holds the Summary (Live) and (when displayed) the Summary (Dump). Use tabs (located along the bottom of the window) to select which to display. Code from several modules may be open at any time, each in its own tab.

Code is displayed immediately when you select a module from the Module Tree, but only if the source code for that module exists on your workstation. If you have only the compiled module (.RUN file) then you cannot examine its code.
Note also, the Source Code button in the toolbar. If the source code is available on your workstation, use this to open the file in your default editor.

Hover the pointer over variables in the code to see a tool tip that contains the variable's name, its current value, and a tool to change the display format (decimal, hex, etc.) or for complex types, open a pop-up window with detailed information about the variable's content. Double-click the variable's name within the tooltip to (briefly) highlight the line where that variable was declared.

For a given module, there may be several running instances or none. VTScada will make a "best attempt" to find a value for the variable for display within this window, but for greatest control over which instance's value you are examining, use the Module Content List window.
