The Code Coverage Display
When code coverage mode has been switched on, using the Toggle Code Coverage button, the module tree and the code display windows will change. The module tree will display each module with a colored indicator that shows what percentage of the module has been covered by running code.
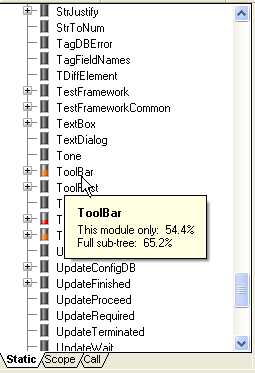
Resting the mouse pointer over a module causes a tool tip to appear, showing the code coverage within the module, and within the entire module sub-tree.
The color indicators are as follows:
- Gray - no code coverage.
- Red - minimal code coverage.
- Orange - medium coverage.
- Yellow - high coverage.
- Green - full coverage.
The code display window will look similar to the following:
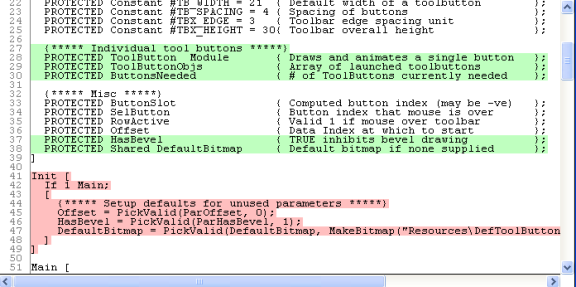
The highlight colors are user-configurable. (See: Source Debugger Options). The default colors have the following meanings:
- Green background: Indicates variables that have not been covered.
- Red background: Indicates statements that have not been covered.
- White lines indicate code that has been run and variables that have been used.
If the entire window changes to a yellow background, this indicates that the source code has been changed since the application was last compiled. For the code coverage system to work, all changes must be compiled. You may need to re-start the application.
