
If the tag that triggered an alarm can be viewed in the Historical Data Viewer (HDV), then you can open the HDV for that tag directly from the alarm list.
To plot from the alarm list:
- Ensure that only one alarm entry is selected.
- Right-click on that entry in the alarm list.
A context menu opens. - Click, Plot.
The HDV page opens as a pop-up window, showing the trend plot of whatever tag triggered the alarm.
Alternatively, left-click on the alarm, then click the Plot button in the toolbar:
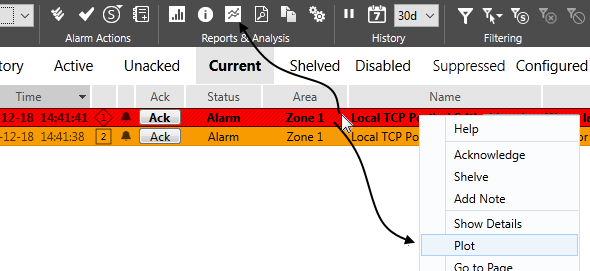
Plot the selected alarm
Troubleshooting:
- The plot entry is disabled.
The trigger associated with this alarm cannot be plotted in the HDV.
Your account does not have permission to view the Historical Data Viewer page.
