HDV Element Reference
Overview of the Historical Data Viewer (HDV) features.

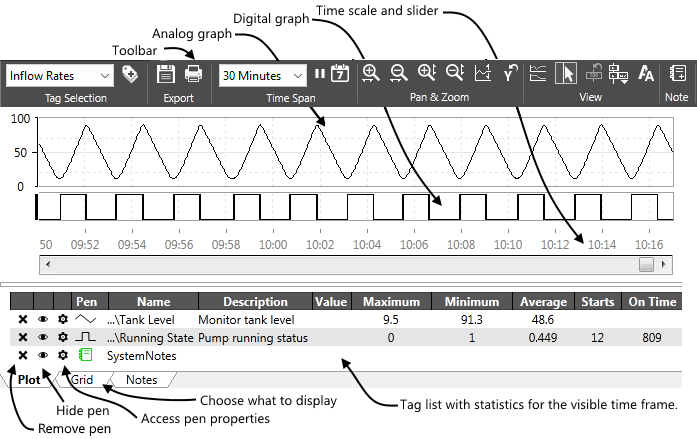
Elements of the Historical Data Viewer
- The Tool Bar. In order from left to right this provides access to the following tools.
- Retrieve named pen groups.

- Select what is to be plotted.

- Export the displayed data.

- Display a different length of time.

- Display a different day.

- Zoom in on a particular duration of the time frame.

- Zoom out from the time frame.

- Zoom in on the plot amplitude.

- Zoom out from the plot amplitude.

- Move one or more plots vertically.

- Reset the vertical axis.

- Separate Graphs.

- Display a marker line at the cursor.

- Hide Data Value - removes data value labels that you have added to the display.

- Data Window Options. (Display tag value only or value plus one of short name, full name, or description.)

- Adjust the text size.

This steps through 5 sizes, changing both the main display and the title bar. - Add a note (select a Notebook pen first).

- Print the displayed data.

- Retrieve named pen groups.
The Pen Legend.
The pen legend appears across the bottom of the Historical Data Viewer page. It acts both as a guide to the pens that are plotting data on the graph, and as a means of displaying additional relevant data for each. An example of the pen legend is displayed here:

Analog plots are indicated in the pen legend by the  symbol, digital plots are indicated in the pen legend by the
  symbol, and notebooks are indicated in the pen legend by the
  symbol.
A pen that is selected in the pen legend will be highlighted in blue. To select a pen, click it in the legend or click an entry in its scale to the right or left of the graph. To deselect all pens, click the selected pen again.
There are columns for both analog and digital values. Where they do not apply to one type or the other, the entry will simply be blank.
Operators can move the cursor across the graph to see a the value of each tag for any time displayed. Note that this may be an average of several logged values covered by one pixel on the displayed graph, rather than each logged value.
- Click the gear icon to open that pen's properties dialog.
- Click the eye icon to hide or reveal that pen in the graph.
