
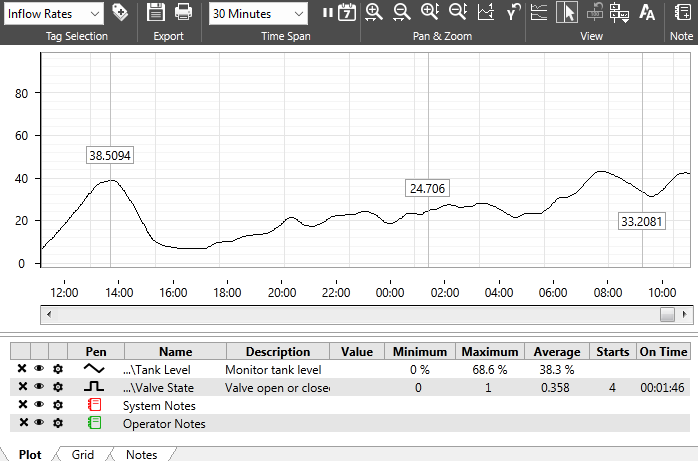
Since the Historical Data Viewer's vertical scale shows only the minimum and maximum values, it can sometimes be difficult to read a value between these limits. Adding value labels to the graph removes this problem by showing the value(*) at the selected point in time.
(*) Note that this is the graphed value, not necessarily a logged value. Graphed values are the average of all data points under a selected pixel.
The content of the label is controlled by the adjacent tool, Data Window Options:
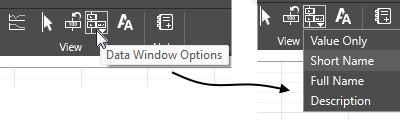
The label will include the tag value in all cases. You can choose to add any one of Short Name, Full Name, or Description.
To add a label:
- Select an analog pen by clicking on it in the legend area.
- Click on the graph, lining up the cursor with the moment in time at which you want to display the tag's value.
A label will be displayed, with a line marking the point in time.
To remove a label:
There are three ways to remove labels. Each is a one-step process.
- Click on an existing label. It will be removed from the plot.
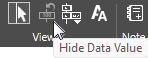
- Click the Hide Data Value button. All labels will be removed from the plot.
- Close the HDV window and re-open it. Labels are temporary markers, not permanent additions to the plot. All are removed when the page is closed.
Troubleshooting:
- The label does not appear.
- An analog pen must be selected in the legend before a label can be added.
- Control buttons at the top of the HDV such as Zoom-Out or Shift-Y-Axis will interfere with this process. Ensure that none of these are selected.
