Monitor Servers, Disk Space, and Memory
Customers frequently ask for a way to monitor server health, or the amount of free disk and memory space available. These tasks can be accomplished with Workstation Status Tag
To configure, create one Workstation Status tag for each server that runs your application. The Workstation tab of each tag holds a configuration field where you can select the workstation name.
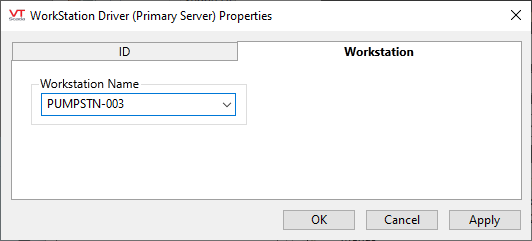
A Workstation Status driver, configured to monitor the primary server.
Monitor Server Status
The Workstation Status tag will have a value of either 0 (meaning no error) or Invalid (meaning no connection). You can use this fact to create an alarm when a server is offline. In the following example, an Alarm tag was created as a child of the Workstation Status Driver, Primary Server. The triggering expression is
! Valid([Primary Server])
where [Primary Server] is the name of the Workstation Status tag in this example. Substitute the name of your own tag for your alarm expression.
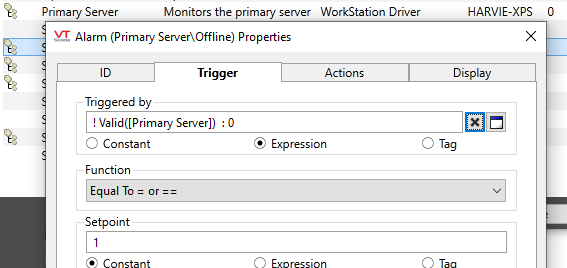
The alarm is triggered when the connection to the parent tag, [Primary Server], is lost.
Add an On Delay of one or two seconds to the alarm configuration. Whenever the application restarts, there will be a moment between the tag starting and the workstation's status being reported. During that time, the driver's value will be INVALID and will trigger the alarm unless you configure a delay. This will also avoid alarms due to transient network interruptions.
Monitor Free Disk Space
Refer to Workstation Status Driver I/O Addressing for a list of workstation properties that you can monitor. For this example, the goal is to trigger an alarm when the free space on drive C: falls below 50Mb. (50Mb is 50*1024*1024 = 5324800 bytes)
To do this, create an I/O and Calculations tag as a child of your Workstation Status driver, configured as an analog. Key details of the configuration are shown in the following two figures.

Detail showing the read address of an Analog I/O tag attached to the Workstation Driver

Alarm setpoint detail from that same tag.
The disk space would be easier to read if measured in megabytes.
Do so with the Scaling tab, setting the Unscaled Process Data Max to 1048576
and the Scaled Process Data Max to 1.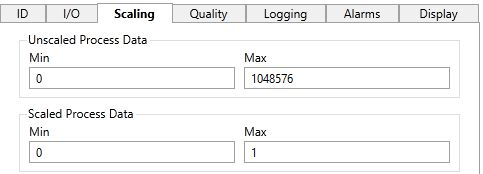
Applying this to the previous example, you would then be able to use 50 as your alarm setpoint instead of 5324800.
To scale for gigabytes instead of megabytes, multiply the Unscaled Process Data Max by 1024 once more: 1073741824
Monitor Memory Space in Use
Refer to Workstation Status Driver I/O Addressing for a list of workstation properties that you can monitor. For this example, the goal is to trigger an alarm when the memory used by VTScada rises above a given level, or when the rate of change over a period of time remains positive.
To do this, create an I/O and Calculations tag as a child of your Workstation Status driver, configured as an analog and also a Rate of Change tag monitoring that I/O tag. Key details of the configuration are shown in the following figures.
In this example, the I/O tag is scaled from bytes (1048576 for the Unscaled Process Data Max) to megabytes (1 for the Scaled Process Data Max). High memory usage in this example is defined as 800Mb. Your value will differ. Monitor your system over several days to gain a sense of the normal memory requirement and choose an alarm setpoint above that.
Monitoring the memory in use:

Detail showing the read address of an Analog I/O tag attached to the Workstation Driver

Alarm setpoint detail from that same tag.
Monitor for increasing memory use over 15 minutes:
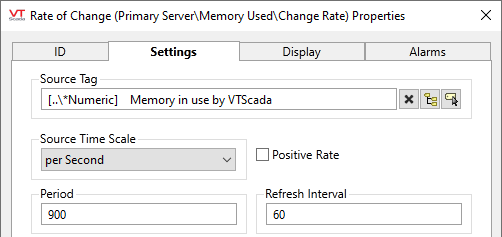
Detail of the Rate of Change tag. 900 seconds is a 15 minute period, refreshed every minute.
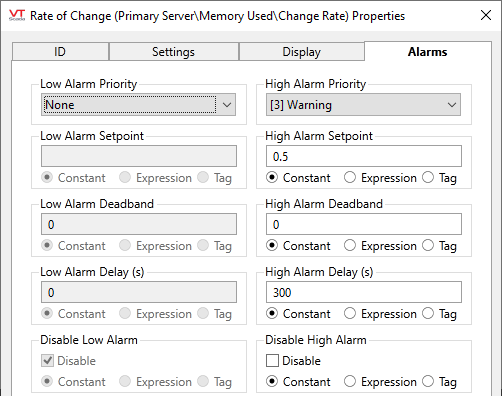
In this example, the rate of change must remain over 0.5 for five minutes (300s).
Estimate Days Left Before Your Hard Drive is Full
The following example is for advanced developers who are comfortable with scripting expressions.
It is possible to configure tags to provide a broad estimate of the time remaining before your hard drive fills up. You can do this by measuring the remaining space, measuring the rate at which space is being used and performing a calculation. The more consistent hard drive use is, the more accurate the estimate will be.
The scenario: You want to monitor hard drive C:\. Your application uses up space at a relatively steady rate and you'd like to know how many days of storage are left.
Four tags will be used:
- Workstation Status tag
- I/O & Calculations (Analog)
- Rate of Change tag
- I/O & Calculations (Analog Calculation) tag
Create a Workstation Status tag to detect remaining hard drive space.
Create an analog I/O tag as a child of a Workstation Status tag. Set the Read Address to "FreeDiskSpace" and select your drive (In our example, the read address displays "FreeDiskSpaceC".)
Find the Rate of Change over a day.
Create a Rate Of Change tag. Link it to the tag from the previous step. To get the rate of change over a day, set the period to 86400 (the number of seconds in a day) and set the refresh interval to 3600 (to refresh the value hourly).
Use an Expression in a Calculation tag to find days left.
Create an analog calculation I/O Calculation tag using an IO & Calculation tag. Use an expression like the following, where these refer to the two tags you just created...
[FreeDiskSpaceC] / [RateOfChange]
which should tell you approximately how many days you would get if the remaining space continued to decrease at the same rate each day.
Replace [Bracketed] terms with tag names. If your tags are not closely related, you may need to scope and specify \value in your expression.
Adapt to Your Application
If you have multiple historian servers you will need to configure multiple Workstation Status tags and pick the smallest remaining disk size to calculate the estimated days remaining.
In the provided scenario, the rate of change is on a per-day basis and it is updated once per hour.
Increasing the frequency may give your Rate of Change tag more data points but it will also impact your application performance.
If your application sees irregular spikes in hard disk space consumption, this will negatively impact the accuracy of your estimate. To smooth out spikes in the estimate, increase your sample size. (Collect the rate of change over a longer span and adjust your calculation expression to estimate days)
You won't see an estimate until a day has passed and under the assumption that there has been a change in hard disk space during this time.
