Lift Station Page
This page will use the information from a Station tag to create complete monitoring and control displays for your pumping stations. The lift station page is normally opened by clicking a Site Draw widget that is linked to a station tag. The contents of this page will vary according to the type of station tag linked to it. This page may also be referred to as the Station Details Page.
If you choose to add a menu item for a Lift Station page, you must configure three parameters:
- The station tag that will be linked to the component widgets.
- Whether the application's color theme will be applied to the page.
- The color to use for labels. This may be an RGB value in the form, <RRGGBB>, or it can be a numeric value as specified in the VTScada color palette.
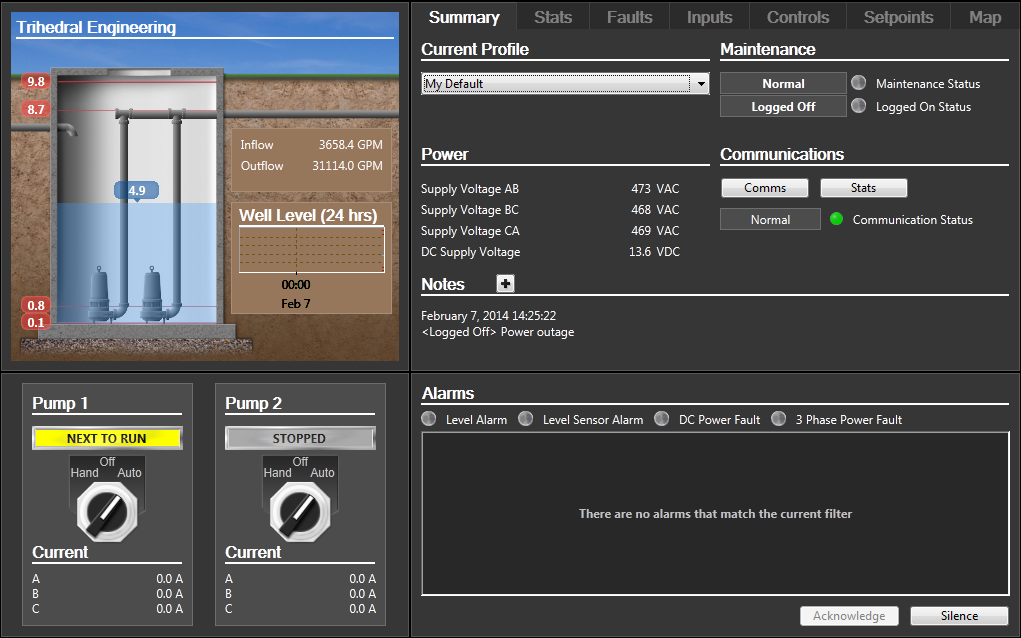
The Station page is an assembly of various monitoring and control drawing methods for the associated station tag. Each component is described in the following sub-topics. The specifics will vary according to whether the station is a MultiSmart, MPE SC series or MPE Duplexer, but most components of the pages will be found for all types of station tag.
Includes the Well Flow and Well Plot drawing methods.
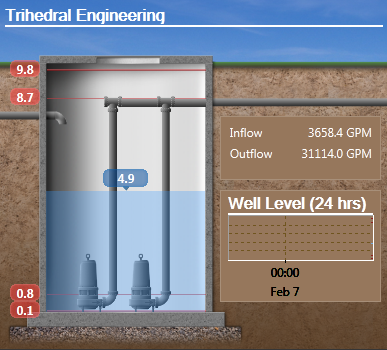
The number of pumps displayed will match the configuration of the associated Station tag. When a pump is running, it will be shown in green.
The current water level is represented by the shaded background and the numeric display. High and low alarm setpoints for the pumps are shown by the red lines with matching numeric values.
The current flow, both in and out, is displayed as well as a trend of the past 24 hours, showing well level and alarm levels.
Provides a Hand-Off-Auto control for each pump in the station.
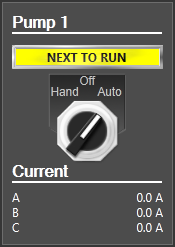
The label indicates whether the pump is running (displayed in green), stopped (gray) or if it will be the next to run (yellow).
The Station Summary varies according to the type of station tag.
MultiSmart Station Summary:
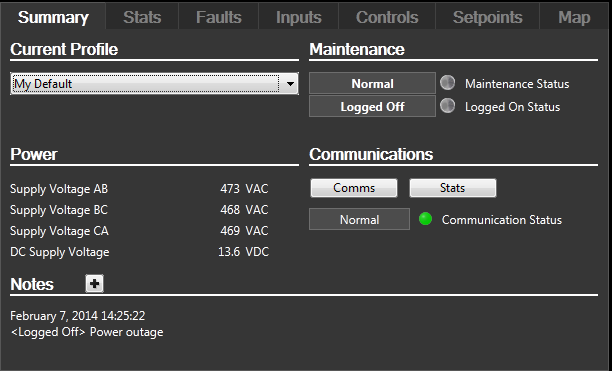
For the MultiSmart Station, six operational profiles may be defined in the Setpoints tab. Profiles are used to store lead and lag setpoints to be used under varying operating conditions such as storms, drought, etc. The profile selection in the summary page shows which is active and select which to use.
If your station uses the Modbus protocol, only the profile number will be shown. If using the DNP3 protocol, you will see the profile description displayed.
Operating notes may be added using the + button. This opens the standard VTScada notebook dialog. Use these to create a permanent record of operational and maintenance tasks.
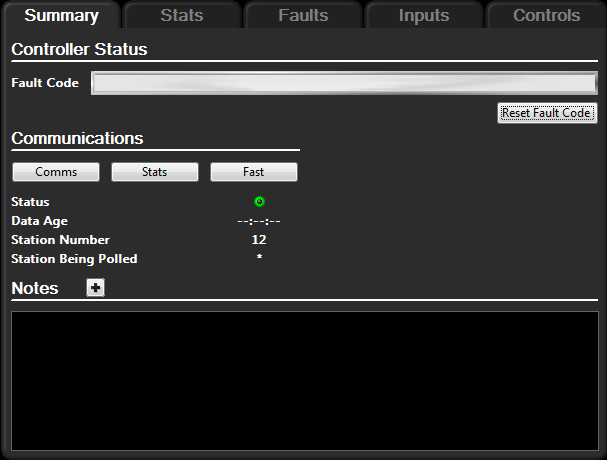
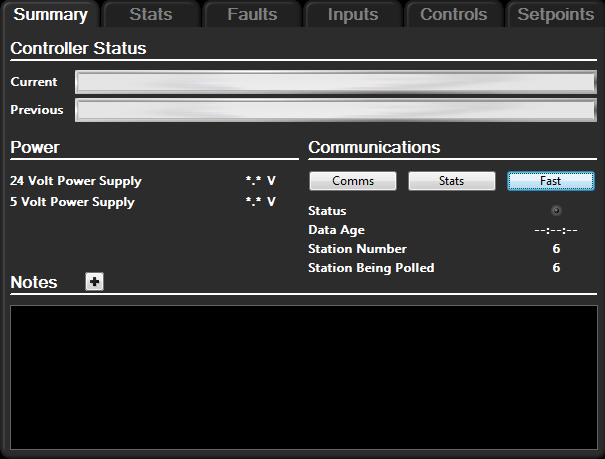
For comparison, the station summary pages for the MPE Duplexer Station and the MPE SC Station are shown in the following images. Note the lack of a Setpoints tab for the MPE Duplexer Station. The MPE SC Station has a Setpoints tab, but only a single profile.
MPE Duplexer Station Summary:
MPE SC Station Summary:
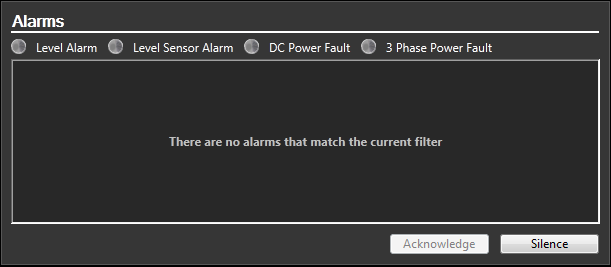
Shows all current faults in the station. You may acknowledge or silence alarms with the buttons provided. A blinking indicator shows that the alarm has not received a reset, sent from the Faults tab.
An extensive collection of statistics is collected and displayed for each individual pump, the station as a whole, and the well.

Tabs across the top of the display provide access to different sets of statistics. The number of tabs and the statistics gathered will vary with the type of station controller.
Within any tab, statistics are grouped by item of equipment (pumps, well, station as a whole). The number of equipment items shown will vary depending on your screen size. If there is not enough room to show all items, a scroll bar will be provided so that you can select which set of statistics to view.
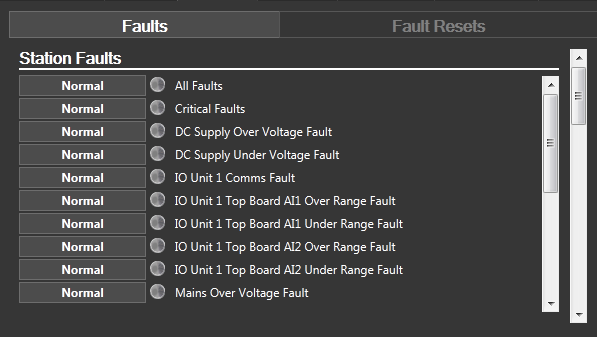
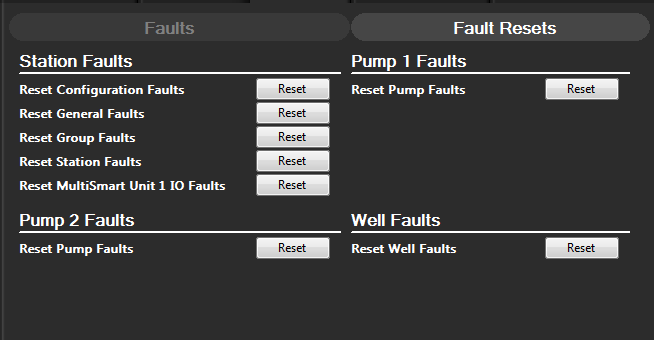
There are two pages within the faults tab: a list of faults, grouped by component and a set of fault reset controls.
Indicators will show red when a fault is present and green otherwise. After a fault has been reset, the corresponding alarm must still be acknowledged in VTS.
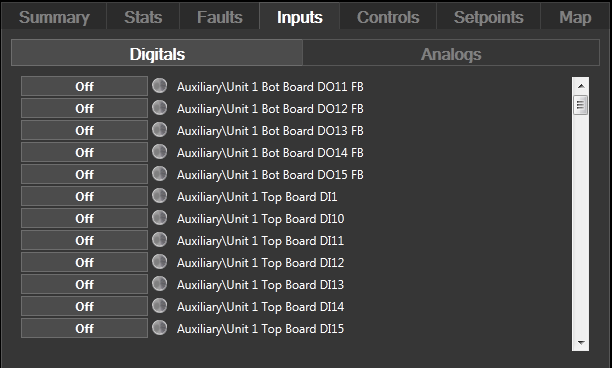
Provides a list of all input tags associated with the station. The list is divided into two pages - digitals and analogs (digitals shown below analogs). For the digitals, a color dot indicates the tag's value: green is used for zero, red for one and gray indicates 'no data'. The analog tags are shown with their current value.
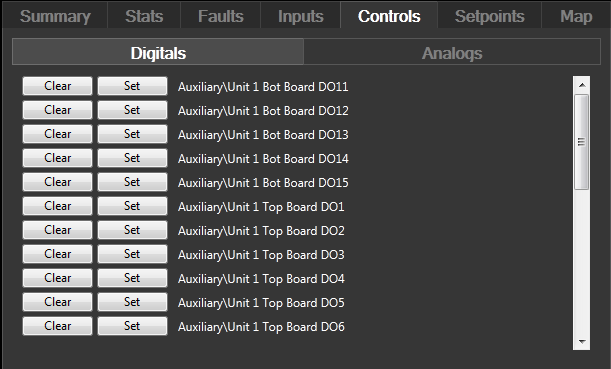
The station controls page provides access to all output tags in the station, grouped by digitals and analogs.
To operate a digital control, click the corresponding button. To operate an analog control, click in the appropriate field as shown, then type the new value that should be written to the station.
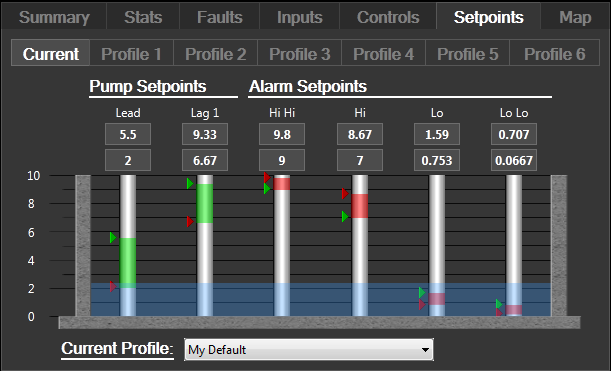
For MPE SC Stations and MultiSmart Stations. Sample image shows the MultiSmart's Station Setpoints display.
Set the lead and lag setpoints for the pumps. One profile can be set for the MPE SC Station, while six profiles may be created for the MultiSmart, each with a different configuration of setpoints. These are provided to allow operators to quickly switch operating parameters in response to changing conditions such as an approaching rainstorm, etc. The various profiles are used only for changing the pump lead and lag setpoints. Alarm setpoints are accessed only through the Current tab of the display.
For reference, the display also shows the current depth of water in the well as a blue background.
You can adjust the setpoints using the sliders, or for greater accuracy, you may type values into the fields above each setpoint slider.
