Flow Computer Displays
The Flow Computer tag creates its own display dialog allowing users to view most aspects of the device on a single page. The same dialog is used for the display of all Flow Computer tags, with specifics changing to meet the configuration of the individual Flow Computer tag.

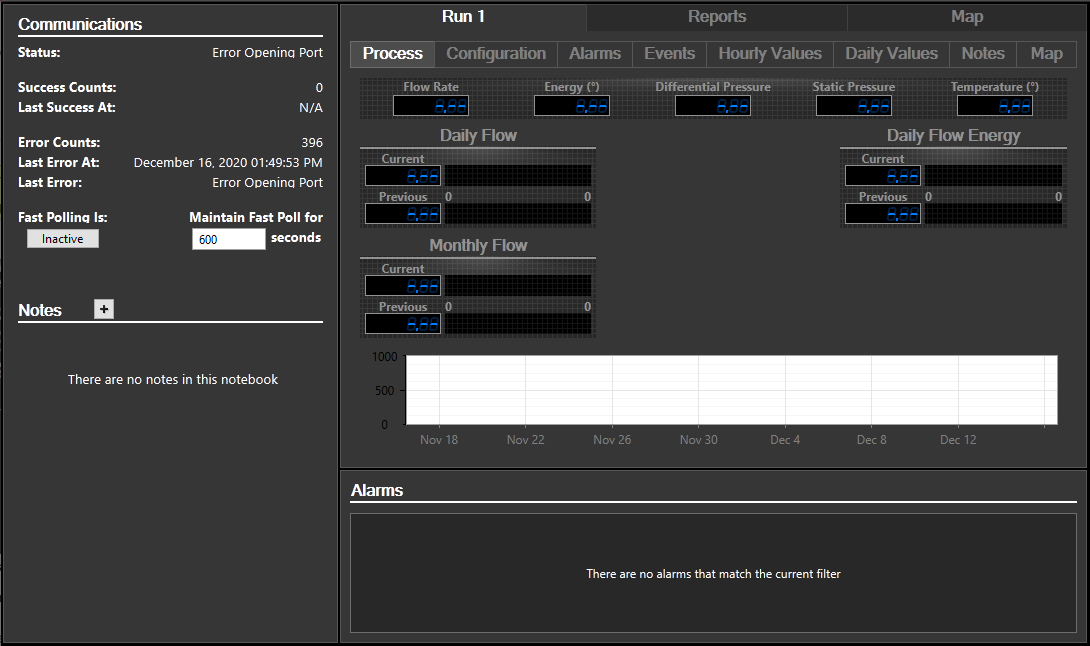
Sample shows the Meter Run Display tab selected.
The display includes four areas:
(Upper left) Displays communication statistics for the site. The Fast Poll button will trigger immediate reading of all process data (but not history, alarms, events or configuration data).
(Note to developers: This section of the display is also known as a "Flow Computer Device Summary".)
Notes
(Lower left) Displays operator notes for the site. Users with the appropriate privileges can add notes as required.
Alarms
(Lower right) Displays the current process alarms for the site. Note that these are the alarms generated by VTScada based on the user-added process tags, not the alarms from the RTU’s Alarm & Event logs.
Site Data Window
(Upper right) Displays the data and mapping for the site in several formats. This display allows you to display information common to the entire flow computer or display data for each individual meter run.
This section of the display includes several tabs, each with its own components, as described in the following sections.
In the sample image at the beginning of this topic, the Run 1 tab is selected, showing the Meter Run component of the page. A tab will be available for each Meter Run within your Flow Meter. This display includes a number of tabs, as follows:
Process / Custom Tab
The process display shows a number of the automatically configured process Analog Status tags in numeric, bar graph, and trend format. If a custom page has been selected in the Meter Displays tab of the Flow Computer tag’s configuration folder then that custom page will appear in place of the standard Process Tab.
Configuration Tab
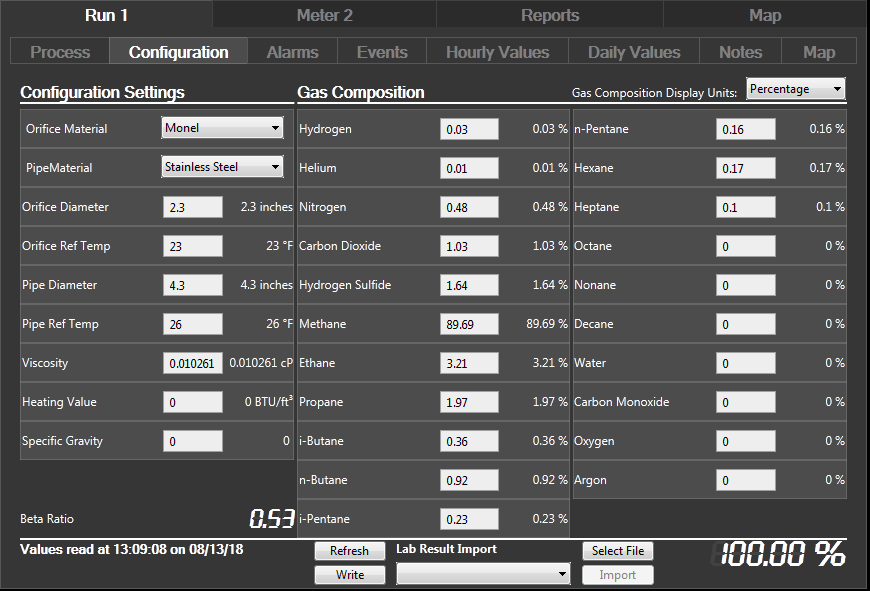
The configuration display allows users to view and update a number of commonly changed meter run specific configuration settings. Provided that the user has sufficient privileges to make these changes, the values may be edited directly and saved to the RTU using the “Write” button. When editing, any value changed by the user is highlighted in green until written to the field I/O device using the Write button. At any time, the display may be updated from the field I/O device by clicking on the “Refresh” button.

This figure shows a device configuration. Note that the gas Composition section MUST balance out to 100.00% before it can be written to the device. If not balanced, the “Write” button will not be enabled and the “Gas Total” value will display in orange instead of white as shown in the following example:

If you would like to put a similar limitation on your Beta ratio, you can edit the high and low limits using the application settings OGBetaRatioHigh and OGBetaRatioLow.
Closing the window or switching to another tab at any time abandons the current set of edited values and will NOT write them to the field I/O device.
Importing Gas Composition Lab Results from a CSV File
There are several different labs that will analyze a sample from a well and provide a CSV file with its composition. VTScada allows you to import the data from CSV files using the controls of the bottom of the Configuration tab. (Refer to the preceding figure.) Note the droplist, which provides a choice of file formats to import. Each lab formats their files slightly differently, and VTScada needs to know which format to use in order to properly extract the information.
After a format has been selected, press the “Select File” button to choose the file to read. Pressing the “Import” button will read the file and fill in the appropriate fields on the screen, but the data will not be written back to the flow computer until the “Write” button has been pressed.
Alarms, Events, Hourly Values and Daily Values Tabs
These tabs are similar to the Reports discussed above, except that they show only the data relevant to this particular meter run and not to the flow computer as a whole.
Notes
Similar to the flow computer’s notes tab discussed above, you can add notes specific to each meter run as well.
Meter tab visibility can be toggled on a tag by tag basis, or globally, affecting all Flow Computer tags. Adding the following properties to the application will allow control of which meter tabs are visible across all Flow Computer tags in the application:
- All-OGFCDisableProcessTab
- All-OGFCDisableConfigTab
- All-OGFCDisableAlarmsTab
- All-OGFCDisableEventsTab
- All-OGFCDisableHourlyTab
- All-OGFCDisableDailyTab
- All-OGFCDisableNotesTab
Setting the value of these properties to 1 will cause the associated tab to be hidden. Setting the value to 0 will cause the associated tab to be displayed.
Tab visibility can also be controlled on a tag by tag basis by replacing the characters “All” in the previously listed property names with a specific meter tag name. Any meter-specific setting will override the global “All” setting. Any space characters “ “ in the tag name must be replace by an underscore “_” character. For example, to disable the process tab for “ROC Com 1\Site1\Meter 1” meter tag, a property named “ROC_Com_1\Site_1\Meter_1-OGFCDisableProcessTab” must be added to the application and its value set to 1.
