Collecting Data
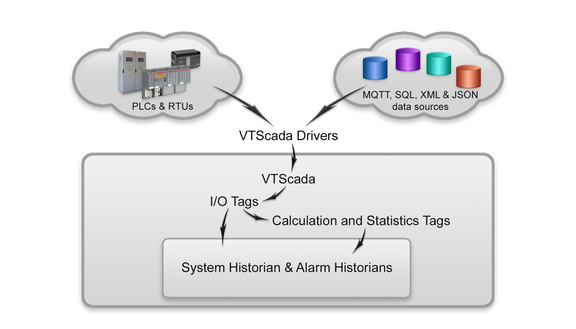
In VTScada, data comes from tag values. At a minimum, you can count on the following three pieces of information being available:
- The name of the tag from which data is being collected.
- A UTC timestamp recording when each value was collected.
- The value of the tag.
Alarm history is similar:
- The identity of the tag triggering the alarm.
- A status describing the alarm transaction: triggered, normalized, acknowledged, shelved, etc.
- The UTC time stamp recording when the transaction occurred.
- The setpoint of the alarm and the value of the trigger at the time of the transaction.
- Further details about the transaction...

Values from status tags (Analog, Digital, Pump) are logged automatically. For certain other tags, you must add a logger. If a tag is not logged, then historical information will not be collected for any report.
Logging isn't free. It costs CPU time and disk space.
Log everything that you need but think about your choices, especially the frequency at which tags poll and the deadband you set on analog values.
The frequency of data collection depends on the tag configuration. Status tags with a built-in Historian link write to the log when the value changes by an amount set in the tag configuration (deadband setting). Logger tags can write at a set interval or they can log on change (without the benefit of a deadband.)
The value being recorded depends on the tag to which the logger is attached. In most cases, this will be a simple measurement taken directly from a tag such as an Analog Status. If the data source for the logger is a calculation tag, then anything that can be calculated from the system (the sum of several other tags, an average over time, etc.) can be logged.
The logged data for each tag is stored in directories named after that tag. There will be one set of these directories for each Historian in the application, all of which are collected under a folder named DATA. (For example, C:\VTScada\MyAPP_AH\Data\History\[SystemHistorian]\.)
The data is stored using a proprietary format that is not published. You are advised to use the tools provided with VTScada to access the information.
As an alternative, you can configure the Historian tag(s) to save data to a 3rd party database such as Oracle or MySQL. If doing so, it is your responsibility to install and maintain the database program and data. Whether you use the VTScada data storage system or a 3rd party database, the primary tools for reviewing historical data are the History Data Viewer and the VTScada Reports Page.
Dealing with Daylight Savings Time:
VTScada records all data using UTC timestamps. In UTC, time advances at the rate of one second per second (barring leap-seconds) and if you were to plot your data against UTC time, you would see an uninterrupted line, assuming that your system is up and running, logging data.
Complications arise in places where daylight savings time (DST) is used. When DST starts in the spring, clocks jump forward from 2:00:00am to 3:00:00am. As far as UTC is concerned, data continues to be logged at the same rate, but if viewed on a graph that shows the local time, there will be a gap or a straight line showing no data for that hour. This is not a problem with VTScada. The gap exists because no time passed when the clock jumped forward, and therefore there is no data for that hour. Nothing can be shown.
Also, that day is 23 hours long, not 24, which may affect your reports. Again, this is not a problem with VTScada. According to your local clock, the DST-transition day had only 23 hours, therefore a daily report can include only 23 hours worth of data.
In the autumn, when daylight savings time ends, you can expect the same in reverse. It will appear that an hour's worth of data is over-written during the transition as the local clocks repeat that hour. That day is 25 hours long.
Rest assured that VTScada is faithfully and steadily recording your data, regardless of what your local clocks are doing.
